Power BI Project Management Dashboard Template
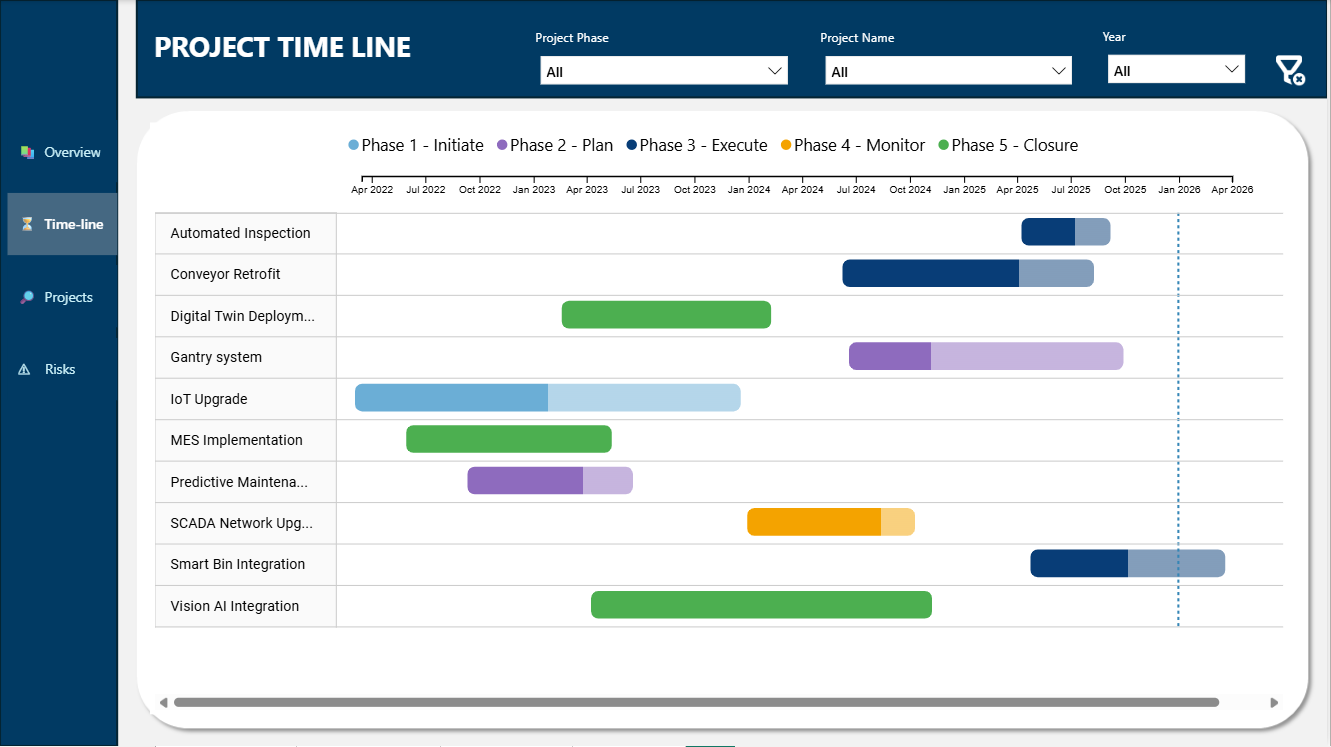
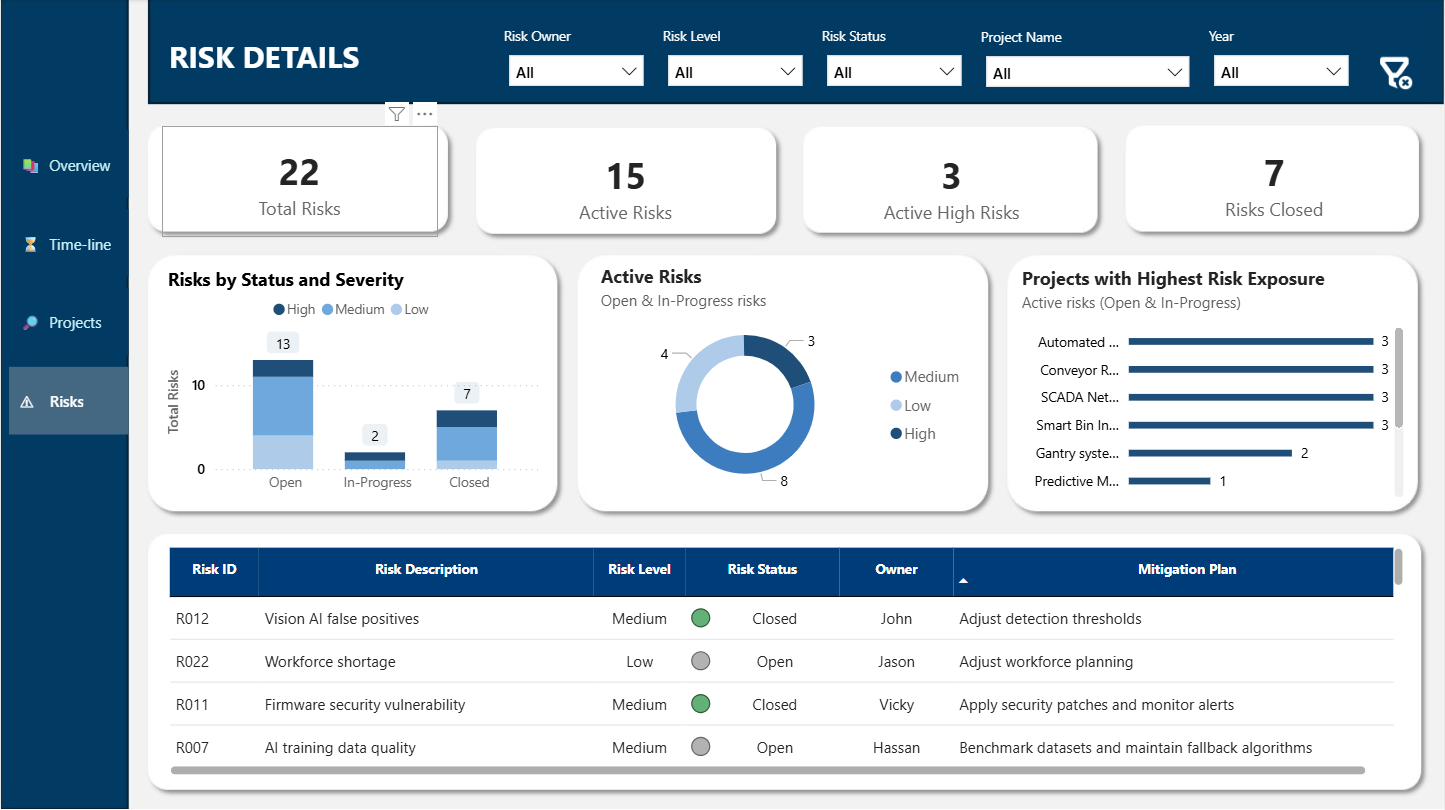
Track portfolio health, Gantt timelines, cost variance, workload distribution, and risks — all in one interactive executive-ready dashboard built for PMOs and project managers.
 Instant Download
Track portfolio health, Gantt timelines, cost variance, workload distribution, and risks — all in one interactive executive-ready dashboard built for PMOs and project managers.
Instant Download
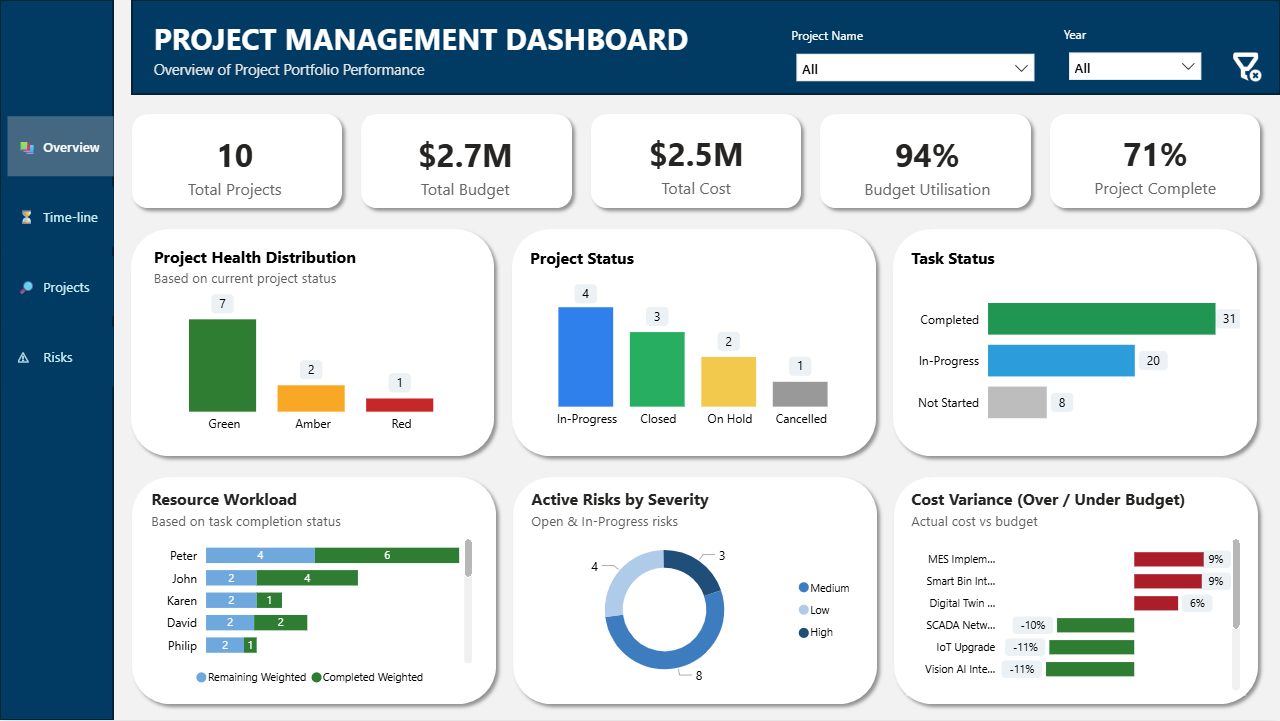
Managing multiple projects across spreadsheets, disconnected Excel files, and manual reports often creates inconsistent data, delayed decision-making, and limited executive visibility. This Power BI Project Management Dashboard Template centralizes portfolio reporting into one structured and interactive system designed for real-world project operations.
Instead of building complex dashboards from scratch, you can deploy a ready-built reporting framework that provides instant visibility into project status, cost variance, timeline performance, resource workload, and risk exposure.
This dashboard template is suitable for construction programs, IT and digital transformation initiatives, manufacturing operations, engineering teams, and PMO portfolio management environments. Whether managing a single large program or multiple concurrent projects, the reporting structure supports clarity and consistency.
The included Power BI (.PBIX) file is fully editable and built on a clean relational data model. Users can replace the structured sample Excel dataset with their own project data while maintaining the existing reporting framework. The dashboard works with Microsoft Power BI Desktop (free version supported).
If you need structured, repeatable, and professional multi-project reporting without building dashboards from scratch, this Power BI template provides a strong operational foundation.
Need customization, additional KPIs, industry-specific adjustments, or enterprise usage support? Send your enquiry below.